Should You Use Bollinger Bands?
From the onset, let me say that Bollinger Bands, developed in the early 1980's by John Bollinger can be a very effective aid in your trading arsenal.
I personally used them for years when I traded professionally, but have since slacked off using them in favor of a different methodology.
This does not mean, by any stretch of the imagination, that Bollinger Bands cannot be meaningful and helpful in your trading effort, and there are days when I am having trouble getting a read on the market action that I will add the Bollinger Bands for added insight into the days market action, especially if the price action is particularly ambiguous.
As I have drifted from theories centered around static volatility toward more dynamic volatility, specifically chaos theory and fractal formations, I gradually moved away from Bollinger Bands.
I would also point out that John Bollinger was one of the first to implement a system that incorporated dynamic volatility into technical trading with bands.
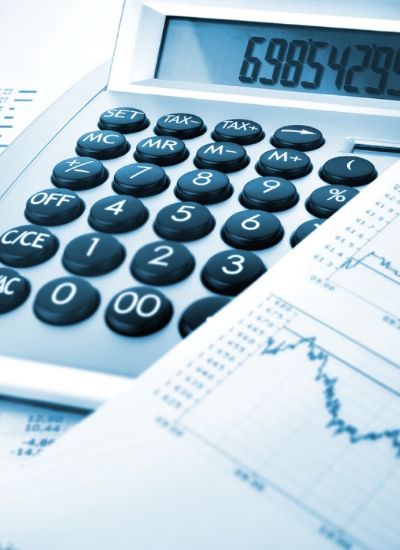
Like most channels, the band is based upon a specific time period (most people use 20 periods, but there are much shorter and longer variations on this system) and measure market movement by applying standard deviations, usually two standard deviations, from the intermediate trend.
Period closings above or below the two deviation channel indicate, essentially, an overbought or oversold condition in the market.
A careful look at a chart with Bollinger bands will indicate a high correlation between closes above or below the the band channel, or as it sometimes referred to, the Bollinger envelope, and a reversal in price action.
There is a modicum of mathematical knowledge required to calculate a basic standard deviation, though it is not really necessary anymore to do so as most trading programs have the Bollinger Band formula, along with specific parameters the user can set, built right into the chart.
With a simple click and a few selections of time periods you will have the Bollinger Band channel on your chart.
Most formulations of the Bollinger system use a simple moving average as the centerline on which to calculate the standard deviation range.
Though I have read several articles which propose using a different moving average formulation, some exponential, others proposing smoothing factors, to determine the intermediate center line on which the channel is based.
I advise everyone to pop a Bollinger Band channel on your chart from time to time and get a feel for this useful indicator.
One days when I am having a difficult time getting a feel for the market, I often add this indicator to gain greater insight into the days price action.
I personally used them for years when I traded professionally, but have since slacked off using them in favor of a different methodology.
This does not mean, by any stretch of the imagination, that Bollinger Bands cannot be meaningful and helpful in your trading effort, and there are days when I am having trouble getting a read on the market action that I will add the Bollinger Bands for added insight into the days market action, especially if the price action is particularly ambiguous.
As I have drifted from theories centered around static volatility toward more dynamic volatility, specifically chaos theory and fractal formations, I gradually moved away from Bollinger Bands.
I would also point out that John Bollinger was one of the first to implement a system that incorporated dynamic volatility into technical trading with bands.
Like most channels, the band is based upon a specific time period (most people use 20 periods, but there are much shorter and longer variations on this system) and measure market movement by applying standard deviations, usually two standard deviations, from the intermediate trend.
Period closings above or below the two deviation channel indicate, essentially, an overbought or oversold condition in the market.
A careful look at a chart with Bollinger bands will indicate a high correlation between closes above or below the the band channel, or as it sometimes referred to, the Bollinger envelope, and a reversal in price action.
There is a modicum of mathematical knowledge required to calculate a basic standard deviation, though it is not really necessary anymore to do so as most trading programs have the Bollinger Band formula, along with specific parameters the user can set, built right into the chart.
With a simple click and a few selections of time periods you will have the Bollinger Band channel on your chart.
Most formulations of the Bollinger system use a simple moving average as the centerline on which to calculate the standard deviation range.
Though I have read several articles which propose using a different moving average formulation, some exponential, others proposing smoothing factors, to determine the intermediate center line on which the channel is based.
I advise everyone to pop a Bollinger Band channel on your chart from time to time and get a feel for this useful indicator.
One days when I am having a difficult time getting a feel for the market, I often add this indicator to gain greater insight into the days price action.